The How of Leadership Teams

The How of Leadership Teams

After reading Katie Brinton’s article “Following the Leader” in the March 2024 issue of SAM, I wanted to raise my hand and say I agree with everything she wrote, but will state it more simply.

Like most people who have held leadership roles in business, especially in the ski industry, I had no leadership training. I learned through trial and error and from my mistakes. Today, there is a lot more information available via courses, books, and the internet. Some are good, and some are not so good. In my retirement, I stumbled across one of these sources, which I believe is excellent and, most importantly, simple to understand. I know Steamboat, under Chris Diamond’s leadership, introduced what I am about to share.

Katie’s article described six team conditions. One of them, the right people, is the leader’s biggest responsibility and is not well adhered to in the ski industry. Leadership has some not-so-joyous requirements, like finding the right people (and moving or removing the wrong ones). If you don’t have the right people, do you understand why?

I would encourage you to do two things to help you understand why people perform as they do. Have your team take the Working Genius Assessment and the Team Assessment Report. These two tools will provide insight into how your team members fit into a team environment and what their strengths and weaknesses. Some of your team members might just be in the wrong seat on the bus.

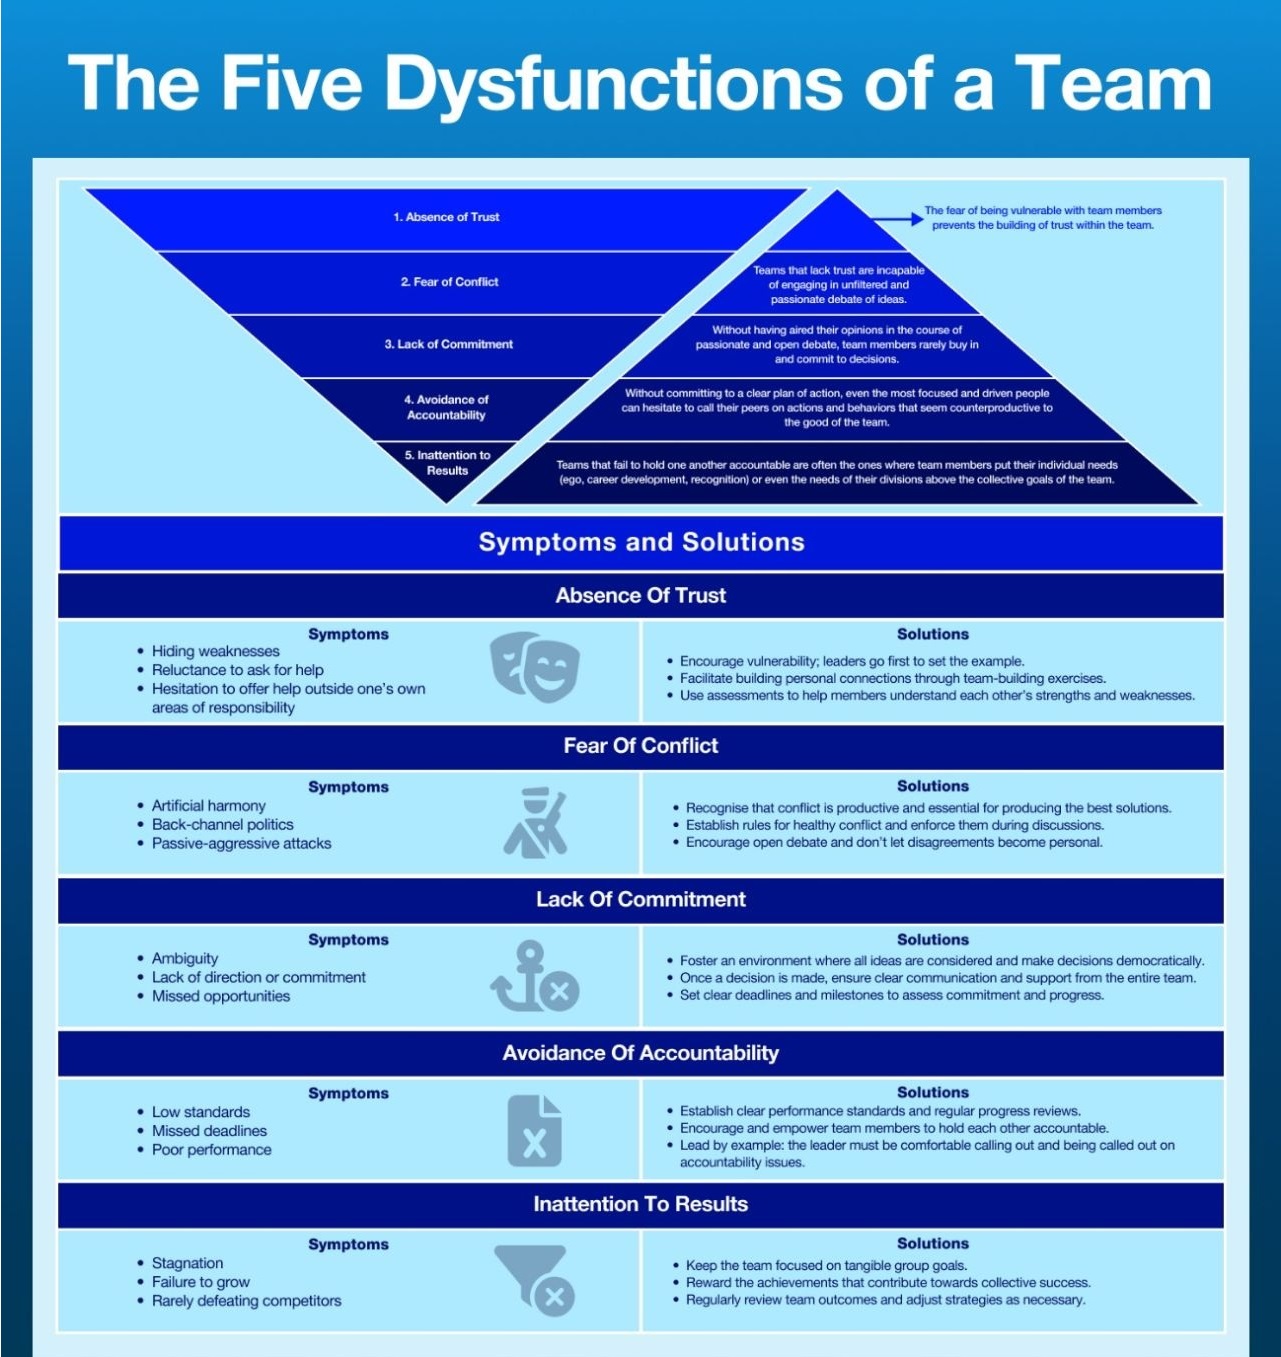
These two tools are products of the Table Group, a firm founded by Patrick Lencioni, an author and pioneer of the organizational health movement. The Table Group has explored companies/organizations, large and small, to find out what makes them successful financially and a good place to work. I became an avid follower after reading “The 5 Dysfunctions of a Team” and read every book the Table Group published.

I will use two infographics to explain the concept put forth by the Table Group for successful leadership and teams.

The first depicts the symptoms and the solutions of poor teamwork of a team and the second depicts how you implement the strengths of functional leadership to make a company, a division, or a department a healthy organization or culture.

Please enlarge to see more detail


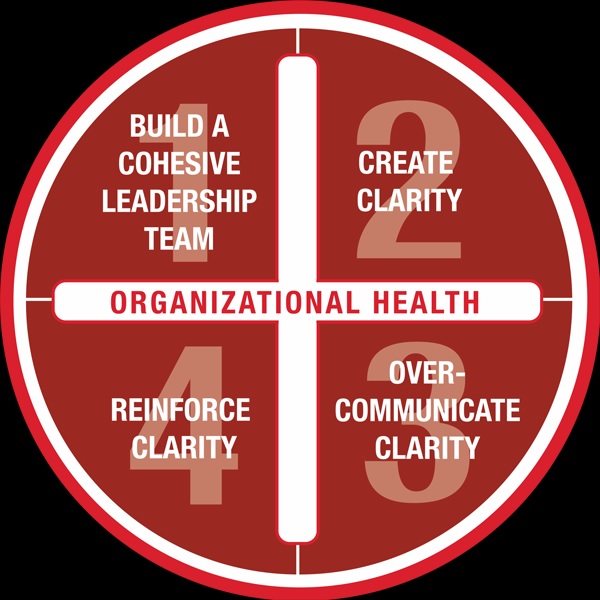
The success of Step 1 is ensuring the team fully grasps and buys into the first infographic. Then, in Step 2, you create Clarity by answering these six questions, with all team members committing to the answers—one consistent message and direction for the team and the company.

The 6 Questions to Clarity

Why do we exist?

ٚ How do we behave?

ٚ What do we do?

ٚ How will we succeed?

ٚ What is most important right now?

ٚ Who must do what?

Then, you fully engage in steps 3 and 4 throughout the company with everyone from lifties to the GM.

I encourage you to read “The 5 Dysfunctions of a Team. In fact, the first five people who respond with their name and address will receive a copy of the book free of charge.

I have received training from the Table Group and am happy to help or can connect you directly with them. But most importantly, read the book. I bet you will finish it in one sitting.

Data and Information

Database of record: Centralized and organized data assists in recognizing and evaluating patterns, resulting in more thoughtful planning and informed predictions.

Rapid, intuitive retrieval of current and historical data (accessible on or offsite) improves decision making at all levels of management.

Simple report generation.

Reduces risk and potential lawsuits.

Supports visualization of current and future mountain infrastructure (e.g. Gazex explosives locations, forest thinning, designing new runs, parking, etc.).


Please click on the images to learn more

Ski Patrol

  • Ease of real-time data entry (no more logbooks or spreadsheets!).
  • Use of common language allows for consistent communication and information sharing.
  • Increases safety by minimizing accidents through pattern analysis of incidents.
  • Accident Investigation and Risk Management.
  • Snow Safety (Ski Patrol) Training.

The web and mobile application suite will provide editing and data collection tools for mapping incidents (wrecks, accidents) of any kind.

Please click on the images to learn more.

Avalanche Module


Ability to document, track and analyze slope conditions with one tool.

Ease of real-time data entry (no more logbooks or spreadsheets!).

 Centralized and organized data assists in recognizing and evaluating patterns, resulting in more thoughtful planning and informed predictions.

Provides detailed current and historical weather patterns for visualizing/predicting.

Saves money through more precise use of explosives. 

Please click on the images to learn more.

Dispatch

The dispatch and risk module leverage Esri’s Survey 123 for ArcGIS, providing an intuitive survey-form, data-driven workflow for point feature collection and reporting. Data collected with SmartMountain Survey apps, which are available for both web browsers and native desktop and mobile apps for standard operating systems, are integrated with one or more SmartMountain modules, providing real-time or disconnected and later synchronized workflows for data collection and integration.

Each ski resort decided what they wish to display on the Dispatch Dashboard including on-hill incidents, walk-in incidents, on-hill refusals,  missing persons, work details for different departments, ski patrol rosters for the day, clearances, and sweeps.

Please click on the images to learn more.

OPERATIONS LOGBOOK

  • Logs for Lift Maintenance, Lift Operations, and Groomer inspections, as well as building inspections.
  • Logs can record data and signatures, can record stops, station assignments.
  • Logs are tracked by calendar.

INFORMATION

  • Management review made easy through the use of Excel – reviewing a major grouping of assets or a single component of an asset such as a drive or a gearbox.
  • All information related to a system(asset) is in one place whether it be a lift inspection report, a manual, oil analysis, a service bulletin, or a letter from a vendor.

DASHBOARD

  • Every user has a unique dashboard.
  • Dashboards can be customized to reflect a user’s specific needs.
  • Quick access to the status of work and cost .

SCHEDULE/ WORK ORDERS​

  • The schedule function in MountainOffice provides for detailed instructions by task, recording of data such as the temperature of a gearbox, and service bulletins.
  • All schedules can have a time or counter trigger.